For decades, the gold standard for evaluating a water meter has been the AWWA flow test. Pull the meter, haul it to the shop, run water through it at three flow rates, and check whether the readings fall within spec.
It works. But it only tells you so much.
A flow test captures how a meter performs at three specific flow rates, under controlled conditions, on one specific day. What it can’t tell you is how that meter performs across the full range of flows it actually sees: every hour, every day, over weeks and months.
That’s the gap Meter Health Analytics was built to close.
We’ll crawl down there so you don’t have to.
How Traditional Flow Testing Works
AWWA standards (C700 series) define a straightforward process: test a meter at low, medium, and high flow rates and check whether accuracy falls within the acceptable range, typically 98.5% to 101.5% for new meters.
For a bench test, the meter comes out of the ground, goes to the shop, gets tested, and goes back. For a field test, crews bring portable equipment to the site. Either way, you get a pass/fail result at three data points.
The limitations are well understood across the industry:
- It’s a snapshot. A meter that passes today could drift out of spec next month. You won’t know until the next test, which might be years away.
- It’s disruptive. Bench testing takes the meter out of service. Someone’s water gets shut off. Crews are dispatched, hydrants are hooked up, traffic may be affected.
- It misses where the real losses happen. Most revenue loss occurs at low flows: drips, leaks, continuous low-demand periods. Standard flow tests rarely capture these conditions accurately.
- It’s expensive to scale. At $150–$500 per meter (labor, transport, equipment), most utilities can only afford to test 2–5% of their population each year. The rest go untested.
- It tells you what, not why. A flow test says “this meter is reading 93%.” It doesn’t tell you whether the problem is a crossover valve issue, fouling, wear, mis-sizing, or something else entirely.
What Continuous Diagnostics Look Like
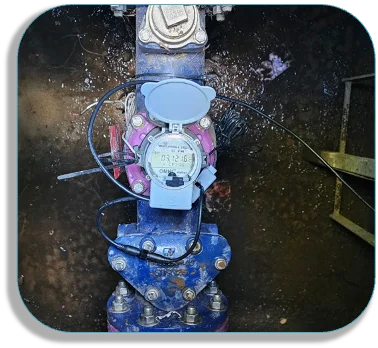
Meter Health Analytics (MHA) takes a fundamentally different approach. Instead of pulling meters and testing them in a shop, we install IoT sensor nodes directly on the meter, monitoring flow, pressure, and vibration signatures continuously while the meter stays in service.
AI models benchmark each meter against its own historical performance, flagging anomalies as they develop, not months later when a test crew finally gets to it.
Here’s what that means in practice:
- Thousands of data points vs. three. MHA captures real-world performance across the full range of flows a meter actually sees, including the low-flow conditions where under-registration hits hardest.
- Weeks and months, not minutes. Continuous monitoring reveals trends, intermittent issues, and gradual degradation that a one-time test will never catch.
- Zero disruption. The meter stays in service. No shutoffs, no crew dispatch for testing, no customer complaints. Our sensors install quickly and collect data remotely.
- Root cause, not just pass/fail. MHA diagnoses up to 46 distinct error codes, including crossover valve issues, fouling, wear, mis-sizing, and more. Crews know exactly what they’re fixing before they arrive.
- 100% of instrumented meters, continuously. Instead of sampling 2–5% of your meters once a year, every monitored meter is evaluated every day.
We Handle Everything
Here’s the part that changes the math completely: you don’t need to allocate a single crew member.
Olea’s field operations team handles the full lifecycle: installation, validation, monitoring, and removal. We deploy the sensors, we confirm the data, and we deliver actionable diagnostics. Your team gets the results without pulling anyone off their existing workload.
Compare that to a traditional testing program: scheduling crews, pulling meters, transporting them to the shop, running bench tests, reinstalling, and managing the paperwork. That’s weeks of labor for a fraction of the insight.
The Real Comparison
| AWWA Flow Test | MHA Continuous Diagnostics | |
|---|---|---|
| Data points | 3 flow rates, one day | Thousands across real demand patterns |
| Duration | 15–60 minutes | Weeks to months of continuous data |
| Service impact | Meter pulled or flow stopped | Zero; meter stays in service |
| Diagnosis depth | Pass/fail at each flow rate | Up to 46 distinct error codes |
| Crew required | Your team | Olea handles everything |
| Coverage | 2–5% of meters per year | 100% of instrumented meters, daily |
| Low-flow visibility | Limited; tests at set rates | Full; captures actual low-flow events |
| Conditions | Lab/controlled | Real-world field conditions |
Flow Testing Isn’t Wrong. It’s Just Not Enough
AWWA flow testing still has a place. It’s a proven method and it’s what most regulatory frameworks reference.
But the industry is moving toward condition-based management for a reason. The Water Research Foundation, AWWA itself, and utilities across the country are recognizing that continuous data beats periodic snapshots, especially for the large commercial and industrial meters where revenue impact is highest.
You don’t have to choose one or the other. But if your current program relies solely on periodic flow tests, you’re making decisions with incomplete information.